47
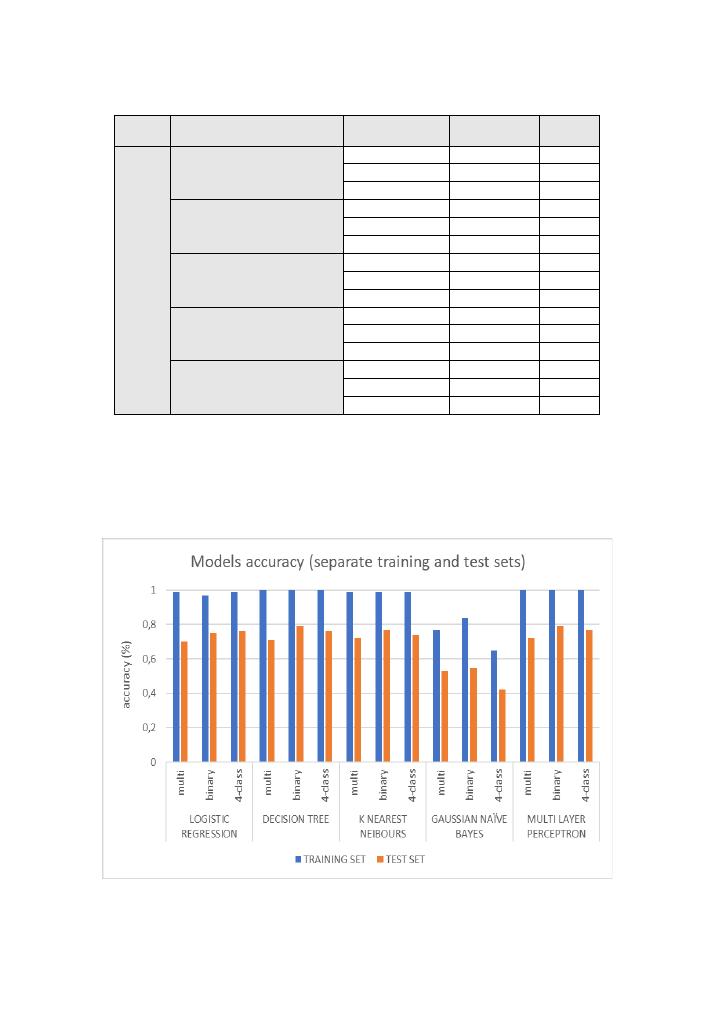
Table 8: summary/comparison of classification algorithms performance in case B
CLASSIFICATION ALGORITHM CLASS SCENARIO TRAINING SET TEST SET
C
ASE
B
:
spl
itting
t
h
e
K
D
D
Tr
a
in
+
in
t
rai
n
in
g and
te
st
/v
ali
d
atio
n
sub
set
s
LOGISTIC REGRESSION
multi
0,99
0,99
binary
0,97
0,97
4-class
0,99
0,99
DECISION TREE
multi
1,00
1,00
binary
1,00
1,00
4-class
1,00
1,00
K NEAREST NEIBOURS
multi
0,99
0,99
binary
0,99
0,99
4-class
0,99
0,99
GAUSSIAN NAÏVE BAYES
multi
0,76
0,76
binary
0,85
0,85
4-class
0,65
0,65
MULTI LAYER PERCEPTRON
multi
1,00
1,00
binary
1,00
1,00
4-class
1,00
1,00
Below (
), we can see the accuracy scores of
form, where it is easier to see the difference between the two cases (using KDDTrain+ and
KDDTest+ versus splitting the KDDTrain+ dataset into training and test sets), but what is also
noticeable is the similarity in the behaviour of all the models between training and test
accuracy scores.
Figure 30: accuracy scores of all models and classification scenarios for case A