35
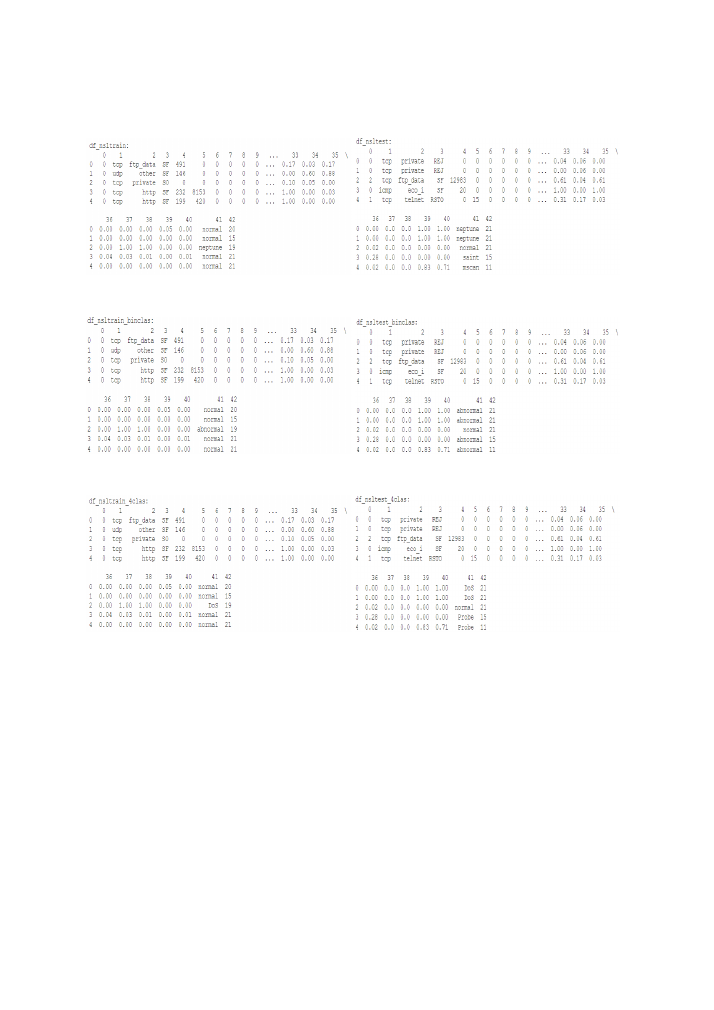
Below, are snapshots of the heads (first five rows) of all the dataframes, as they are displayed
in the Jupyter notebook:
Figure 18: Multiclass training and test dataframes (heads)
Figure 19: Binary training and test dataframes (heads)
Figure 20: 4-class training and test dataframes (heads)
The difference between each pair of dataframes can be seen in column #41, where the traffic
type label has a different set of values.
The next step in the process is to clean any data with the wrong format, drop records with
missing values or redundant records. As was explained in a previous section, one of the things
that were upgraded from the KDD dataset is that all redundant data were deleted, so the
dataset has only unique records of traffic. After checking that there are no missing features,
no missing values, and no wrong formatted values in the dataset, some adjustments were
made to the dataframes. Firstly, the last column of the dataset, which is the difficulty level of
the records, was dropped, and saved separately into two lists, one for the training and one for
the test difficulty levels. The distributions of each difficulty list can be found in Figure
, where we can see that most records have the highest score (21/21):